1. Introduction
By looking at the CPU utilization flame graph, we observe that the calculation of cross sections in hadronic processes contributes much to the total execution time.
|
|
When we generate a CPU utilization flame graph, we basically let the application run and we capture userspace stack traces at a fixed sampling rate, e.g. 1Hz. Thefore, if one function is called frequently or if it takes much time to complete (or both), it is more likely to that its stack trace will be collected and shown in the graph. |
In this particular case both apply:
1.1. Time spent in ::GetCrossSection()
# dtrace -n '
pid$target::_ZN23G4CrossSectionDataStore17GetCrossSectionEPK17G4DynamicParticlePK10G4Material:entry
{
    @ = count();
}' -c '/home/stathis/mainStatAccepTest ./exercise.g4'

[ ... snip ... ]
 ---  EndOfEventAction  ---  event= 20   t=1.34s   random=0.693159
^C
          4942549     # ~5M times for 20 events (which is a lot)
1.2. How many times ::GetCrossSection() is called
#dtrace -n '
pid$target::_ZN23G4CrossSectionDataStore17GetCrossSectionEPK17G4DynamicParticlePK10G4Material:entry
{
    self->tt = vtimestamp;
}

pid$target::_ZN23G4CrossSectionDataStore17GetCrossSectionEPK17G4DynamicParticlePK10G4Material:return
/self->tt/
{
    @ = sum(vtimestamp - self->tt);
    self->tt = 0;
}

END
{
    normalize(@, 1000000);
}' -c '/home/stathis/mainStatAccepTest ./exercise.g4'

[ ... snip ... ]
 ---  EndOfEventAction  ---  event= 20   t=1.61s   random=0.320998
^C
             3507     # msec (which is also a lot)
2. How to measure the repeatability of the cross section values
|
|
The above method can be applied to any other function in general. |
|
|
The first time I looked at how cross-sections are distributed, and before doing the following elaborate analysis, I did an error in my calculations. The results I got gave me the false impression that there were a lot more repeated values than they actually are. In hindsight, perhaps it wouldn’t make much sense to cache the results, but we should rather attack the problem from another angle. Nonetheless, the following is an interesting reading in my humble opinion. |
2.1. The obvious way
The obvious way would be to make ::GetCrossSection() dump at stdout the
calculated value. The problem with this approach is that it would output
an overwhelming amount of data, plus we would need to write a custom tool
to aggregate the results.
2.2. The DTrace way
In order to use DTrace do the aggregation for us, we first need to consider
some things. DTrace does not operate on floating-point numbers. Nor can it
access (as of yet) the floating-point registers of the FPU, such as ST(0), …
Let us look at the disassembled code of the epilogue of ::GetCrossSection():
        ... snip ...

        fstl   (%eax,%ebx,8)                            ;; store ST(0), 'sigma', to address EAX + 8*EBX
        addl   $0x1,%ebx                                ;; increment EBX by 1
        cmpl   %ebx,-0x24(%ebp)                         ;; compare EBX to 'nElements'
        jg     -0x41    <::GetCrossSection+0x38>        ;; loop if condition true
        addl   $0x3c,%esp                               ;; adjust ESP
        popl   %ebx
        popl   %esi
        popl   %edi
        popl   %ebp
        ret                                             ;; return to caller
Judging from the above we conclude that the result of the calculation is returned via the FPU register, where DTrace doesn’t have access. Whereas, if it would have been stored in some general purpose register, we could read its value.
We workaround the above obstacle by injecting an inline assembly instruction
inside ::GetCrossSection(), so that the result of the calculation is copied
into EAX:EDX. Mind that the result is stored in a double precision variable
(G4double), hence it is 64bits wide, whereas EAX and EDX are both 32bits.
Therefore the result needs to be split into those 2 registers and be reassembled
later. Had we compiled everything in 64bits, we could have used RAX register
which is 64bits wide.
G4double
G4CrossSectionDataStore::GetCrossSection(const G4DynamicParticle* part,
                                         const G4Material* mat)
{
        G4double sigma(0);
        G4int nElements                 = mat->GetNumberOfElements();
        const G4double* nAtomsPerVolume = mat->GetVecNbOfAtomsPerVolume();

        if (unlikely(G4int(xsecelm.capacity()) < nElements)) {
                xsecelm.resize(nElements);
        }

        for (G4int i = 0; i < nElements; ++i) {
                sigma += nAtomsPerVolume[i] *
                    GetCrossSection(part, (*mat->GetElementVector())[i], mat);
                xsecelm[i] = sigma;
        }

        __asm__ __volatile__ ("" : : "A" (*(&sigma)));    // This copies sigma to EAX:EDX

        return sigma;
}
Let us look at the new assembly:
        ... snip ...

       fstl   -0x40(%ebp)               ;; store ST(0) to a local variable
       movl   -0x40(%ebp),%eax          ;; store first  half to EAX
       movl   -0x3c(%ebp),%edx          ;; store second half to EDX, 0x3c + 0x4 = 0x40
       addl   $0x4c,%esp
       popl   %ebx
       popl   %esi
       popl   %edi
       popl   %ebp
       ret                              ;; return to caller
The result of the computation is copied from the ST(0) FPU register to
a local variable, and then it is split into two halves and copied to
EAX and EDX, which is what we wanted. DTrace can now be used to look
at the values of EAX and EDX with the aid of the uregs[] array.
# dtrace -x aggrate=1000us -x aggsize=50M -n
'pid$target::_ZN23G4CrossSectionDataStore17GetCrossSectionEPK17G4DynamicParticlePK10G4Material:return
{
        @[uregs[R_EAX], uregs[R_EDX]] = count();
}' -c '/home/stathis/mainStatAccepTest ./exercise.g4'
   -o uregs.cross
The above script will output something in the following form:
2730418801       1064925043                7
2937292920       1052248252                7
1236151356       1064336539                8
 387162505       1062135956                9
3605409360       1060393923                9
....
The first column is the value of EAX, the second column is the value of EDX and the 3rd column is the count of the respective <EAX,EDX> pair. In order to reassemble the sigma values from the individual 32bit integers, we use a C/C++ union:
union DoubleInt {
        int32_t u_i[2];
        double  u_d;
};
We copy the integers into the u_i[] array, and then print the result
from u_d. So, for instance in a 20 events simulation of simplified
calorimeter:
# tail -n100 uregs.cross | ./reassembly

... snip ...

0.00393944      142
0.00260406      296
0.00104162      409
0.00208325      505
0.0010615       513
0.00243045      526
0.00138883      565
0.000694415     606
0.00573212      740
0.000347208     1190
3.47208e-05     2213
3.47208e-06     2614
0.000173604     3190
0               3103580
2.3. Validation of the divide-then-reassembly procedure
In order to validate the above methodology we made ::GetCrossSection() return
the same hard-coded values always, and saw them (the values) being reassembled
correctly at the other end of DTrace output.
3. The caching algorithm
3.1. First attempt
We used a hash map to store tuples of the form:
((DynamicParticle, Material, Kinetic Energy), (CachedValue)).The hash was computed based on the individuals components of the composite key, e.g., the energy, name of particle, material, etc.
At first, performance was way worse than without caching, which it didn’t make much sense, since I was under the false impression that there would be a lot of cache hits. Also, as the simulation progressed, the performance degraded because the map too often reached its maximum capacity and needed to reallocate memory and rehash all the existing elements.
3.2. Second attempt
After realizing that the cache hits weren’t that many, and by printing statistics on the hash map utilization, I noticed that the map was overwhelmed by values that weren’t reused. I then made the map clear itself when its load factor would go beyond an arbitrary upper bound, 0.8 or so.
That made things better, but still caching was slower than not-caching.
3.3. Third attempt
I restructured the hash map to be of the form:
((Particle, Material, Kinetic Energy), (CachedValue, Count))Every time a cached value was reused, its hit count was increased. Then, when the map would start filling, those values with a hit count less than T would be discarded. That should favor the good values, throwing away the useless in a LRU (Least Recently Used) manner.
That made things better, but now the caching version is just as fast as the non-caching.
|
|
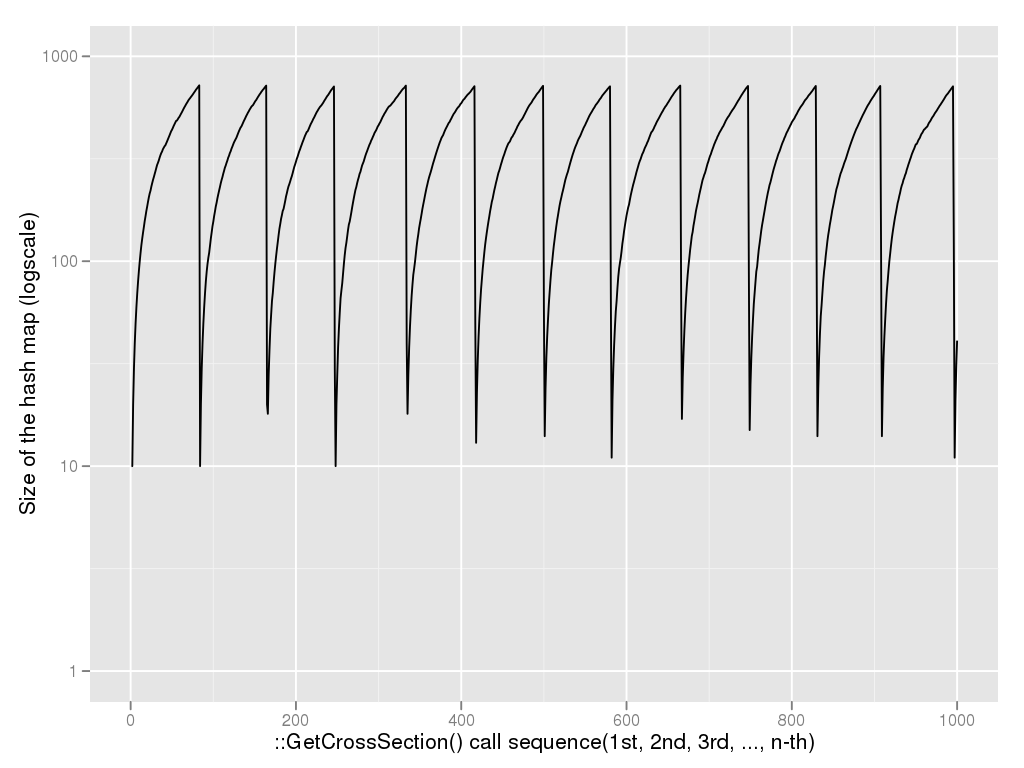
The following graph is not generated from the most optimized set of parameters (neither from the worse). It portrays how the size of the hash map gradually increases as more cross sections are being calculated. At some point the map’s utilization reaches a critical upper bound, when we decide to empty it, preserving the good elements though. Ideally, we would like those residuals element to increase after every purge cycle (here they don’t). |
3.4. Fourth attempth
Since the vast majority of recurring cross section values is zero, I decided
to try caching only those (Particle, Material, Kinetic Energy) keys for which
the cross section calculation would result in a zero outcome. This significantly
increased the hits vs. misses ratio, and also allowed the hash map to reduce in
size (or, relatedly, the hash map to be purged less often).
3.5. Increasing the hits ratio
Regarding the kinetic energy of a particle, it is stored in a double data type, which is
64 bits wide as per the IEEE 754 standard. Out of the 64 bits, the 52 bits are used to
represent the fraction part of the number, which translates to log_10(2^52) ~ 16 decimal
digits of precision.
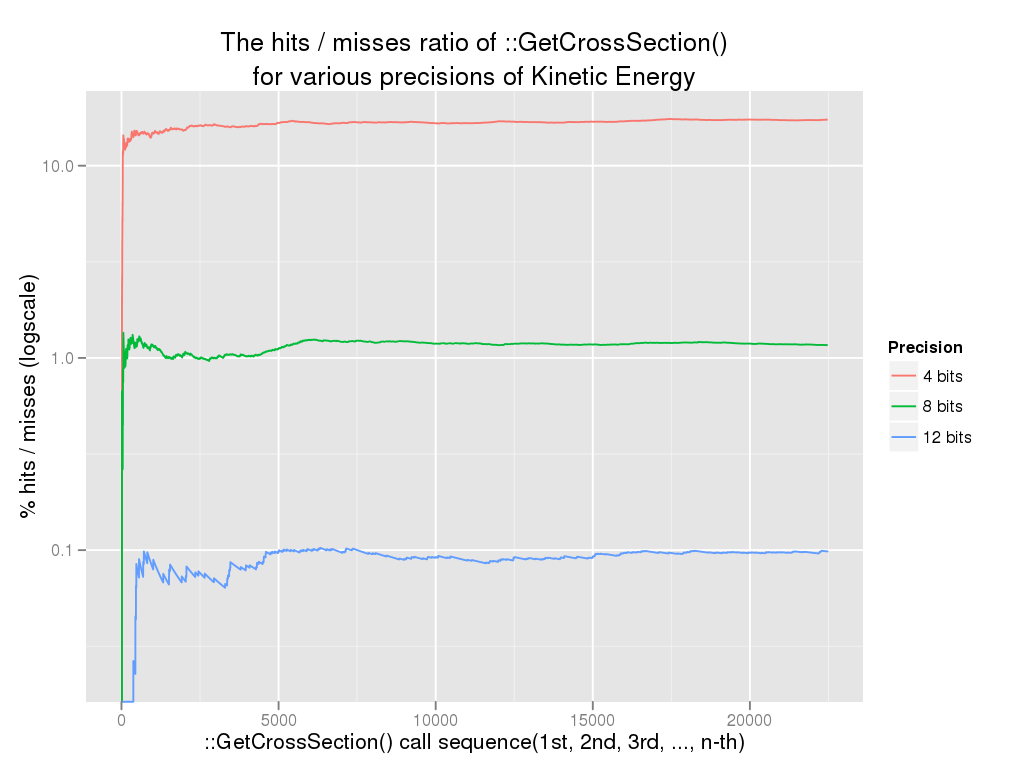
In order to increase the hits ratio, we consider using only up to N bits of
kinetic energy when we form the composite key.
union {
      double d;
      uint64_t i;
} uDoubleInt;

uDoubleInt.d = part->GetKineticEnergy();
std::tuple<const G4DynamicParticle *,
          const G4Material *, uint64_t>
          partmat(part, mat, uDoubleInt.i & 0xFFFFFF0000000000);
This method increases the hits ratio, since more identical tuples are being generated, at the expense though of less precise results.
|
|
The following graph is not generated from the most optimized set of parameters (neither from the worse). It just portrays the depenence of hits/misses ratio on the number of bits that are used when creating the hash key. |
3.6. Which hadronic processes are amenable to cross-section caching ?
Every hadronic process has its own instance of G4CrossSectionDataStore.
By gathering statistics (hits, misses, load factor) on a per
G4CrossSectionDataStore instance basis, we have observed that not all of them
exhibited the same statistical characteristics. Some instances would
have a zero hits/misses ratio, whereas others a ratio of 20. Therefore,
it would only make sense to enable caching on those cases where it could
actually make a (positive) difference.
We subsequently modified the G4HadronicProcess and G4CrossSectionDataStore
classes so that when the former instantiated the latter, it would also
pass its process name and the particle type as the "owner" of the cross-section
data store. This way we could map a G4CrossSectionDataStore instance back to
the hadronic process, and thus identify which one of them would most interest us.
The combinations that manifest a considerable hits/(hits+misses) ratio, at
their (presumed) steady state, in a 5.000 events Full CMS simulation are:
PhotonInelastic  / gamma        ( ~90% )
nFission         / neutron      ( ~98% )
ElectroNuclear   / e-           ( ~94% )
NeutronInelastic / neutron      ( ~35% )
PositronNuclear  / e+           ( ~67% )
hadElastic       / alpha        ( ~41% )

hadElasticTriton / triton       ( ~2-3% )
nCapture         / neutron      ( ~2-2% )
The rest of the combinations fall into the 0-2% range.
The list of plots with cache hits and misses.
The list of plots with hash maps' load factors.
And here is the bash/R script that was used to generate all the above plots.
|
|
In order for a process to benefit from caching, not only do the hits need to outweigh the misses, but also there have to be a lot of cross section calculations. A surrogate marker for the latter is to look at how many samples a hits or load plot has. |
3.7. Validation of the caching algorithm
We can enable a code block, via conditional compilation with #if, which
for every ::GetCrossSection() call it calculates the cross-section via
the normal way (non-caching) and by querying the hash map. It then
compares the results, and returns the correct one, while it increases
a mismatch counter. This way we can be sure that the algorithm doesn’t
produce spurious results.
3.8. Various
Currently every hadronic process has its own instance of G4CrossSectionDataStore
and therefore its own cache. I turned G4CrossSectionDataStore into a singleton
in an attempt to unify the caches, but Geant4 would throw an exception from some
other part of the program.
After talking to John Apostolakis regarding this, not being able to unify the caches should be considered a good thing.

