6 Discussion
6.1 General
VMAT radiotherapy is currently the best treatment delivery method for prostate cancer, but VMAT plans have grown inherently complex, consisting of hundreds of small, irregularly shaped apertures with varying beam intensity. When this complexity increases uncontrollably, it may become problematic in terms of, among others, of actual plan deliverability to the patient. Hence, VMAT plans need to undergo meticulous quality assurance and verification processes before being delivered to the patients.50 These procedures require expensive equipment, extensive expertise by the medical physicist, and reduce the availability of the linear accelerator. Therefore, there is a genuine need to streamline the verification process.
A predictive QA system based on machine-learning would benefit both radiotherapy departments’ personnel and cancer patients. The former would be disengaged from the time-consuming verification processes and direct resources to other aspects of radiotherapy’s workflow, such as QA of the linear accelerator or treatment planning. Likewise, patients would benefit from decreased waiting times. Both of these could, in principle, increase the RT department’s patient throughput and help replace conventional 3D conformal radiotherapy with state-of-the-art VMAT treatments.
In the past, there have been efforts to correlate plan complexity with quality assurance indices, such as gamma passing rates. The rationale for this proposition is the following. If we managed to correlate complexity with QA outcomes, we could conceivably bypass the physical verification process merely by calculating the plan’s complexity. However, except for some sporadic positive results,26,27,31 the correlation of these two has remained an elusive goal.51
Another path has been the development of artificial-intelligence (AI) models that predict the verification indices (Fig. 6.1). The proof of this concept was demonstrated in 2018 by Tomori et al.52 The researchers trained a 15 layer convolutional neural network to learn the sagittal planar dose distributions from a QA phantom and produce the 2%/2 mm, 3%/2 mm, 2%/3 mm, and 3%/3 mm gamma passing rates. The network’s input also included the planning target volume, the volume of the rectum, and their overlap region, along with the number of monitor units for each IMRT field. Since then, many other similar papers have been published.53–57
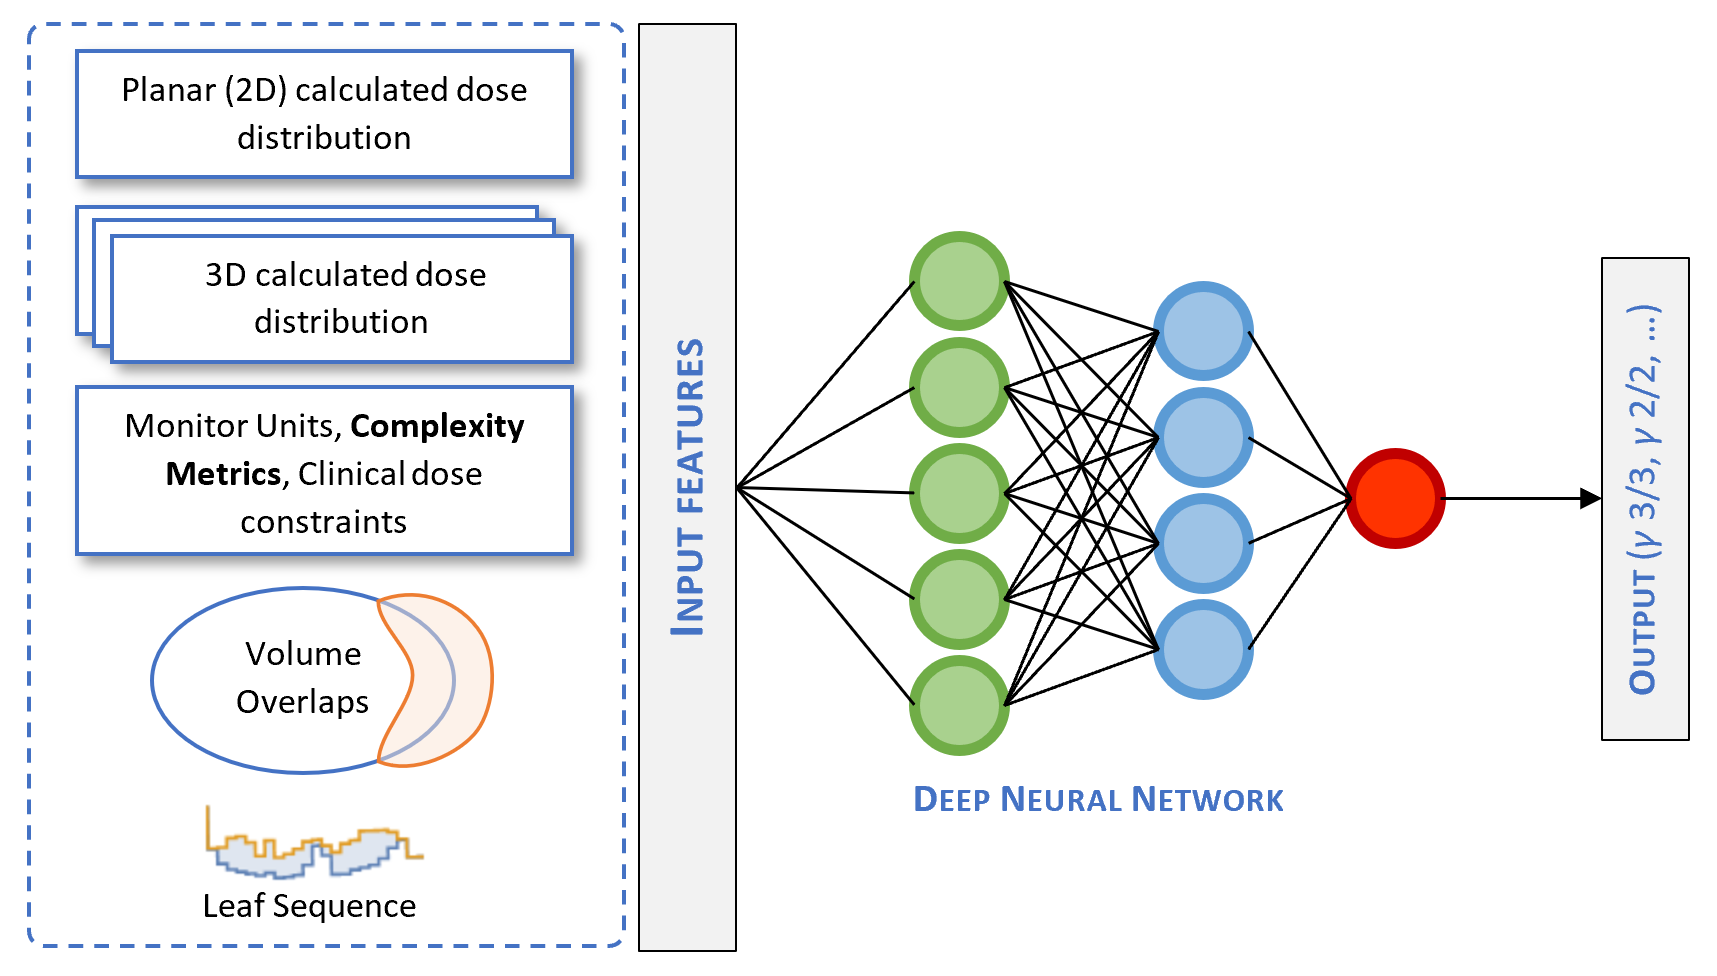
Figure 6.1: Deep neural network architecture of a predictive QA system. Complexity metrics could be used as potential input features in an AI model.
This thesis examined several complexity metrics and attempted to describe a framework for selecting the best index out of the many that exist. We also constructed predictive models of complexity by considering clinical and dosimetric plan features. Our approach compares favorably to sophisticated machine learning models (e.g., neural networks) in that linear and logistic regression models are more interpretable. This is a well-known limitation of machine learning and an area of active research on how to improve them.58 Nevertheless, complexity metrics could be used in conjunction with neural networks (Fig. 6.1) by acting as potential input features.57
6.2 Complexity metrics
In the present study, we dealt with prostate cancer patients undergoing radical treatment with VMAT. After extracting the plans from the oncology information system, we calculated ten complexity indices described in the literature. We then analyzed them with principal component analysis. PCA is a widely used dimensionality reduction technique that exploits linear correlations in a dataset. Through PCA, we can replace the existing variables with new ones, the so-called principal components, yet preserve the qualitative features of the original data.59 Using three principal components, we accounted for 96.2% of the dataset’s variance, effectively reducing its dimensionality from 10 to 3. We also generated a loading plot and recognized the clustering of complexity metrics into three distinct groups.
The first cluster consists of ESF, MFA, and PI. The second consists of EM and SAS, and the last one, the less well-defined, of MCS and MCSV, along with LT and LTMCSV. However, if we consider that LT increases as plan complexity decreases, we conclude that LT too clusters along with ESF, MFA, and PI. These findings suggest that there exists a substantial informational overlap among the various complexity metrics. Given that many of them measure similar aspects of a plan’s aspect, this outcome was expected. For instance, ESF, MFA, and PI are strongly influenced by the field’s open area.
The importance of principal component analysis is bifold. First, it provides insights regarding the interconnectedness of different complexity metrics. In the literature, there are more than forty complexity metrics.25 Based on our PCA and MIA analyses, we hypothesize that there is considerable overlap among them. Second, it opens up new routes to pursue an index that would show a robust correlation with QA metrics. As we have mentioned, the connection between complexity and QA metrics has not been fully realized. To overcome this, we could use a “PCA informed” linear combination of existing complexity metrics to construct a novel metric. This new index would, in principle, combine the unique informational content of all the individual indices. To the best of our knowledge, there have been only a few published papers utilizing PCA to study VMAT plans’ complexity.60
In a similar context, we calculated the entropy of all metrics and mutual information for every complexity metric pair. For \(N=10\) metrics, there were \(N(N-1)/2=45\) pairs. MI is a more robust measure, compared to the correlation coefficient, and captures how much a complexity’s pair’s joint distribution differs from the product of each metric’s marginal distributions. In other words, it quantifies the informational content one obtains about a metric through the observation of another one. This information-theoretic perspective could enrich our understanding of VMAT plans’ complexity. It could also help us navigate the landscape of various complexity indices by combining those with the lowest possible mutual information. This is the case of LT and MCSV, whose MI was very low compared to other pairs (Fig. 5.8). Therefore, the construction of the multiplicative combination, LTMCSV, was sound. Likewise, the choice of LTMCSV as the response variable for the development of predictive models.
6.3 Complexity prediction
6.3.1 The choice of LTMCSV
The choice of a complexity metric that correlates well with one department’s physical verification outcomes has been the “holy grail” of QA. Masi et al. found that LT, MCSV, and LTMCS were all significantly correlated with VMAT dosimetric accuracy expressed in gamma passing rates. In our PC analysis, LTMCSV was found to exert a strong effect on both the first and second principal components. We presume that this is because it carries detailed multidimensional information regarding a plan’s complexity. Also, the pair LT, MCSV had low mutual information, justifying the use of their multiplicative combination. Moreover, LTMCSV showed a clear separation between plans with different field sizes, which we would expect for a reliable complexity metric. The last argument in favor of LTMCSV is that it was “arcs agnostic”, in the sense that the number of arcs did not exert much influence on it. For these reasons, we chose to adopt LTMCSV as our response variable while developing the predictive models. However, we keep in mind that every TPS assigns different priorities when modulating a VMAT plan.24 Therefore, for Phillips Pinnacle or Elekta Monaco plans, perhaps \(\text{MI}_{t}\) would be better suited since it accounts for variations in gantry speed, dose rate, and acceleration of the MLC.32
6.3.2 Linear regression model
In the second part of the thesis, we used linear regression analysis to predict the VMAT plan’s complexity from basic clinical and dosimetric features. First, we examined the candidate predictor variables for linear correlations. The latter may cause instability in the estimated coefficients, inflate standard errors and confidence intervals for the model’s parameters, hurting the model’s interpretability. For these reasons, we performed multicollinearity detection through scatter plot visualization and variance inflation factors. In the end, we identified bladder’s \(V_{70}\) and rectum’s \(V_{70}\) as the most significant offenders and omitted them from the list of covariates.
Subsequently, we evaluated various linear regression models constructed through univariate and multivariate analysis, backward and forward selection methods. The evaluation criteria included RSS, adjusted R-squared, and the AIC criterion. The best model turned out to be the one containing all candidate predictors with an adjusted \(R^2=0.671\). The variables that were correlated with increased complexity (i.e., a lower value of LTMCSV) were plans with two arcs (p<0.001), increasing field size (p<0.001), the 15.1.52 treatment planning version (p<0.001), the high dose PTV of 72 Gy (p=0.02), rectum’s \(V_{50}\) (p<0.001), physicians 2 and 7 (p=0.041 and p=0.027, respectively), and high conformation number (p=0.036). The variable that correlated with decreased complexity (i.e., a higher value of LTMCSV) was rectum’s \(V_{60}\) (p=0.011). It is noteworthy that the linear model overestimated complexity (Fig. 5.14). In a production setup, it is preferable to characterize simple plans as complex and have them physically verified, rather than the opposite, i.e., erroneously designate a complex plan as simple and bypass the physical QA procedures. Therefore, the model erred on the right side.
6.4 Plan classification
Following the development of a linear regression model, we dichotomized VMAT plans into high complexity and low complexity ones. Ideally, the threshold choice should be derived from an analysis of complexity vs. quality assurance metrics, such as the gamma passing rates. I.e., plans designated as “low complexity”, under the chosen threshold, should correlate with higher scores in verification procedures. However, this analysis was beyond the scope of this thesis. Instead, we arbitrarily defined “high complexity” plans whose complexity exceeded the dataset’s median value.
After labeling every plan based on its complexity, we split the dataset into a training set (75%) and a test set (25%). We then performed a 5-fold cross-validated logistic regression analysis with LASSO regularization on the former. LASSO is known to invoke sparsity by driving some of the model’s coefficients to zero, which results in feature selection. After determining the optimal cross-validated value of the regularization parameter \(\lambda\) in the training set, we evaluated the best LASSO model to the test set. The accuracy of the model in the test set was 87.25%, and the AUC 0.906. The false-positive rate8 in the test set was 14.8%. Considering the importance of missing a complex plan, one could tune the model to exhibit larger specificity (less FP rate) at the expense of lower sensitivity (higher FN rate).
6.5 Future work
One of the most established QA tools for planar dose verification in IMRT/VMAT is the gamma index analysis, which considers the dose difference (DD) and distance to agreement (DTA) between two distributions.61 Concretely, for each point \(\mathbf{r}_{m}\) in the measured distribution, a dimensionless “distance” metric is calculated via the formula:
\[\begin{align*} \Gamma(\mathbf{r}_m, \mathbf{r}_c) = \sqrt{\frac{r^2(\mathbf{r}_m, \mathbf{r}_c)}{\Delta d_M^2} + \frac{\delta^2(\mathbf{r}_m, \mathbf{r}_c)}{\Delta D_M^2}} \end{align*}\]
Where \(r(\mathbf{r}_m, \mathbf{r}_c) = \left|\mathbf{r}_c − \mathbf{r}_m\right|\) is the distance to agreement and \(\delta(\mathbf{r}_m, \mathbf{r}_c) = D_c (\mathbf{r}_c) − D_m (\mathbf{r}_m)\) is the dose difference. Finally, \(\gamma\) at point \(\mathbf{r}_m\) is defined as the minimum value:
\[\begin{align*} \gamma(\mathbf{r}_m) = \text{min}\{\Gamma(\mathbf{r}_m , \mathbf{r}_c)\} \forall \mathbf{r}_c \end{align*}\]
The total percentage of \(\mathbf{r}_m\) points that have achieved \(\gamma(\mathbf{r}_m) \le 1\), for a given DD/DTA criteria, is calculated, and a pass/fail threshold is set to determine the verification outcome (pass or fail).
Despite its limitations, this analysis is widely adopted in clinical practice and endorsed by the American Association of Physicists in Medicine in Task Group 119, where commissioning tests are described in terms of \(\gamma\) index acceptability of 3% dose difference and 3-mm DTA.62 In the future, we plan to explore whether LTMCSV and novel complexity indices, derived by considering the results of PCA and MIA analyses, could correlate with gamma passing rates in our department.
The probability of characterizing a high-complexity plan as low-complexity.↩︎